House of Einherjar: The art of visual exploitation
Table of Contents
Authors: Seung Kang and Stephen Fox
A CTF challenge called library had me dipping my toes in glibc heap memory exploitation. After giving the challenge my best attempt, I decided to review the provided python pwntools solution and reimplement it using the Golang-based brkit. Throughout this process, I tested out creating various visual aids to make it easier to reason about the Python code’s logic. Picturing how the heap layout evolved at each step of the exploit made a huge difference in my comprehension of the technique used. In this blog post, I want to share what I tried and what the experience taught me.
the challenge
The challenge program is an x86 64-bit ELF file named library which runs on a defender-controlled computer with ASLR enabled. The application must be exploited to get access to a flag file that proves we actually completed the challenge.
The executable has several common exploitation mitigations enabled:
$ rz-bin -I ./library
[Info]
machine  AMD x86-64 architecture
relro    full
canary   true
PIE      true
RELROCS  true
NX       true
(...)
Both the presence of ASLR and the program being a position-independent executable (PIE) indicates there must be an information leak bug in the program. Without an information leak, we have no way of knowing where the executable, its libraries, or the heap are located in memory.
Similar to other heap exploitation challenges, the program presents a TUI-like interface when executed:
$ ./library
welcome to the library!
here you can use the following commands:
	1) order a book
	2) read a book
	3) review a book
	4) manage account
choice:
Entering a number at the choice prompt selects one of the listed options. The user is then returned to the choice prompt. For context, here is what the first three options do when selected (the fourth option is not relevant to the solution):
# order a book
choice: 1
ordering book with id: 0
enter name: hello world
book "hello world" successfully ordered :D

# read a book
choice: 2
enter id: 0
the book "hello world" does not exist D:

# review a book
choice: 3
enter id: 0
enter review length: 10
enter review: book gud
successfully reviewed book :D
We can “order” a book, which allocates a new chunk on the heap and assigns it an identifying number. We can “read” a book, which prints its contents. We can also “review” a book by specifying its ID and the review size. A new chunk is allocated for the review and if one already exists it is freed before allocation.
vulnerabilities
Let’s briefly go over what made the program vulnerable.
information leak
In the previous snippet, you may have noticed this suspicious message:
the book “hello world” does not exist D:
That message occurs because the program treats a “book” as a file path and literally tries to read data from a file named “hello world”. The read size is capped by a 16-bit variable, which prevents leaking the full flag file. However, this behavior provides a (mostly) free information leak by allowing the user to read /proc/self/maps (thank you, Linux!). There are two small caveats to leveraging this behavior:
- We can only read a small amount of data by default.
- There are two code paths responsible for reading a “book” from the file system, one of which does not support the files under
/proc
These issues are overcome by overwriting global variable state using the next bug.
out of bounds access in library array
In the provided library.c code, there is a global variable named library, which is an array of pointers to books. The maximum number of books is defined as 64:
 16 struct Book {
 17   int id;
 18   char name[0x10];
 19   char *review;
 20 };
 21
 22 struct Settings {
 23   uint64_t id;
 24   char profile[0x18];
 25   char *card;
 26   uint16_t comprehension;
 27 };
 28
 29 #define MAX_BOOKS 64
 30 int book_cnt = 0;
 31 struct Book *library[MAX_BOOKS];
 32 // redundant array of independent settings for security :P
 33 struct Settings *settings, *rais1, *rais2;
 34
 35 void order_book()
 36 {
 37   struct Book *book = malloc(sizeof(struct Book));
 38   library[book_cnt] = book;
 39   book->id = book_cnt++;
 40   printf("ordering book with id: %d\n", book->id);
      // ...
 48 }
Ordering a book adds a new entry to the library array, but the program does not check whether the maximum of 64 books has been reached. Once more than 64 books are ordered, the new entries begin to overflow into adjacent memory, specifically the section that holds pointers to the settings, rais1, and rais2 structures.
By overwriting the pointer to the settings structure, the program later accesses the settings.comprehension value, which becomes attacker-controlled. This value is used as the size for a read() call in read_book(). By carefully controlling comprehension, we can read beyond the intended bounds and leak additional memory.
off-by-one with House of Einherjar
After writing a review into a heap-allocated chunk, the program appends a null byte to terminate the string. If the review completely fills the allocated chunk, the null byte overflows into the next chunk on the heap.
The off-by-one bug is a bit challenging to spot because the code that reads the attacker-controlled data and returns the number of bytes read is located inside the buffer’s index accessor brackets:
103   book->review = malloc(len);
104   printf("enter review: ");
105   book->review[read(0, book->review, len)] = 0; // appends null byte past buffer
106   puts("successfully reviewed book :D");
107 }
In this context, the null byte will corrupt the metadata of the adjacent chunk, allowing an attacker to set up the House of Einherjar technique. The House of Einherjar involves forging heap chunk metadata to create a freed region over an arbitrary target memory area. The fake chunk produced by this technique gives the attacker access to normally inaccessible memory, allowing them to overwrite data or corrupt heap tcache metadata to redirect future allocations.
The visual below shows how an off-by-one null byte overwrite sets up the House of Einherjar exploit, allowing an attacker to write to a previously inaccessible memory region.
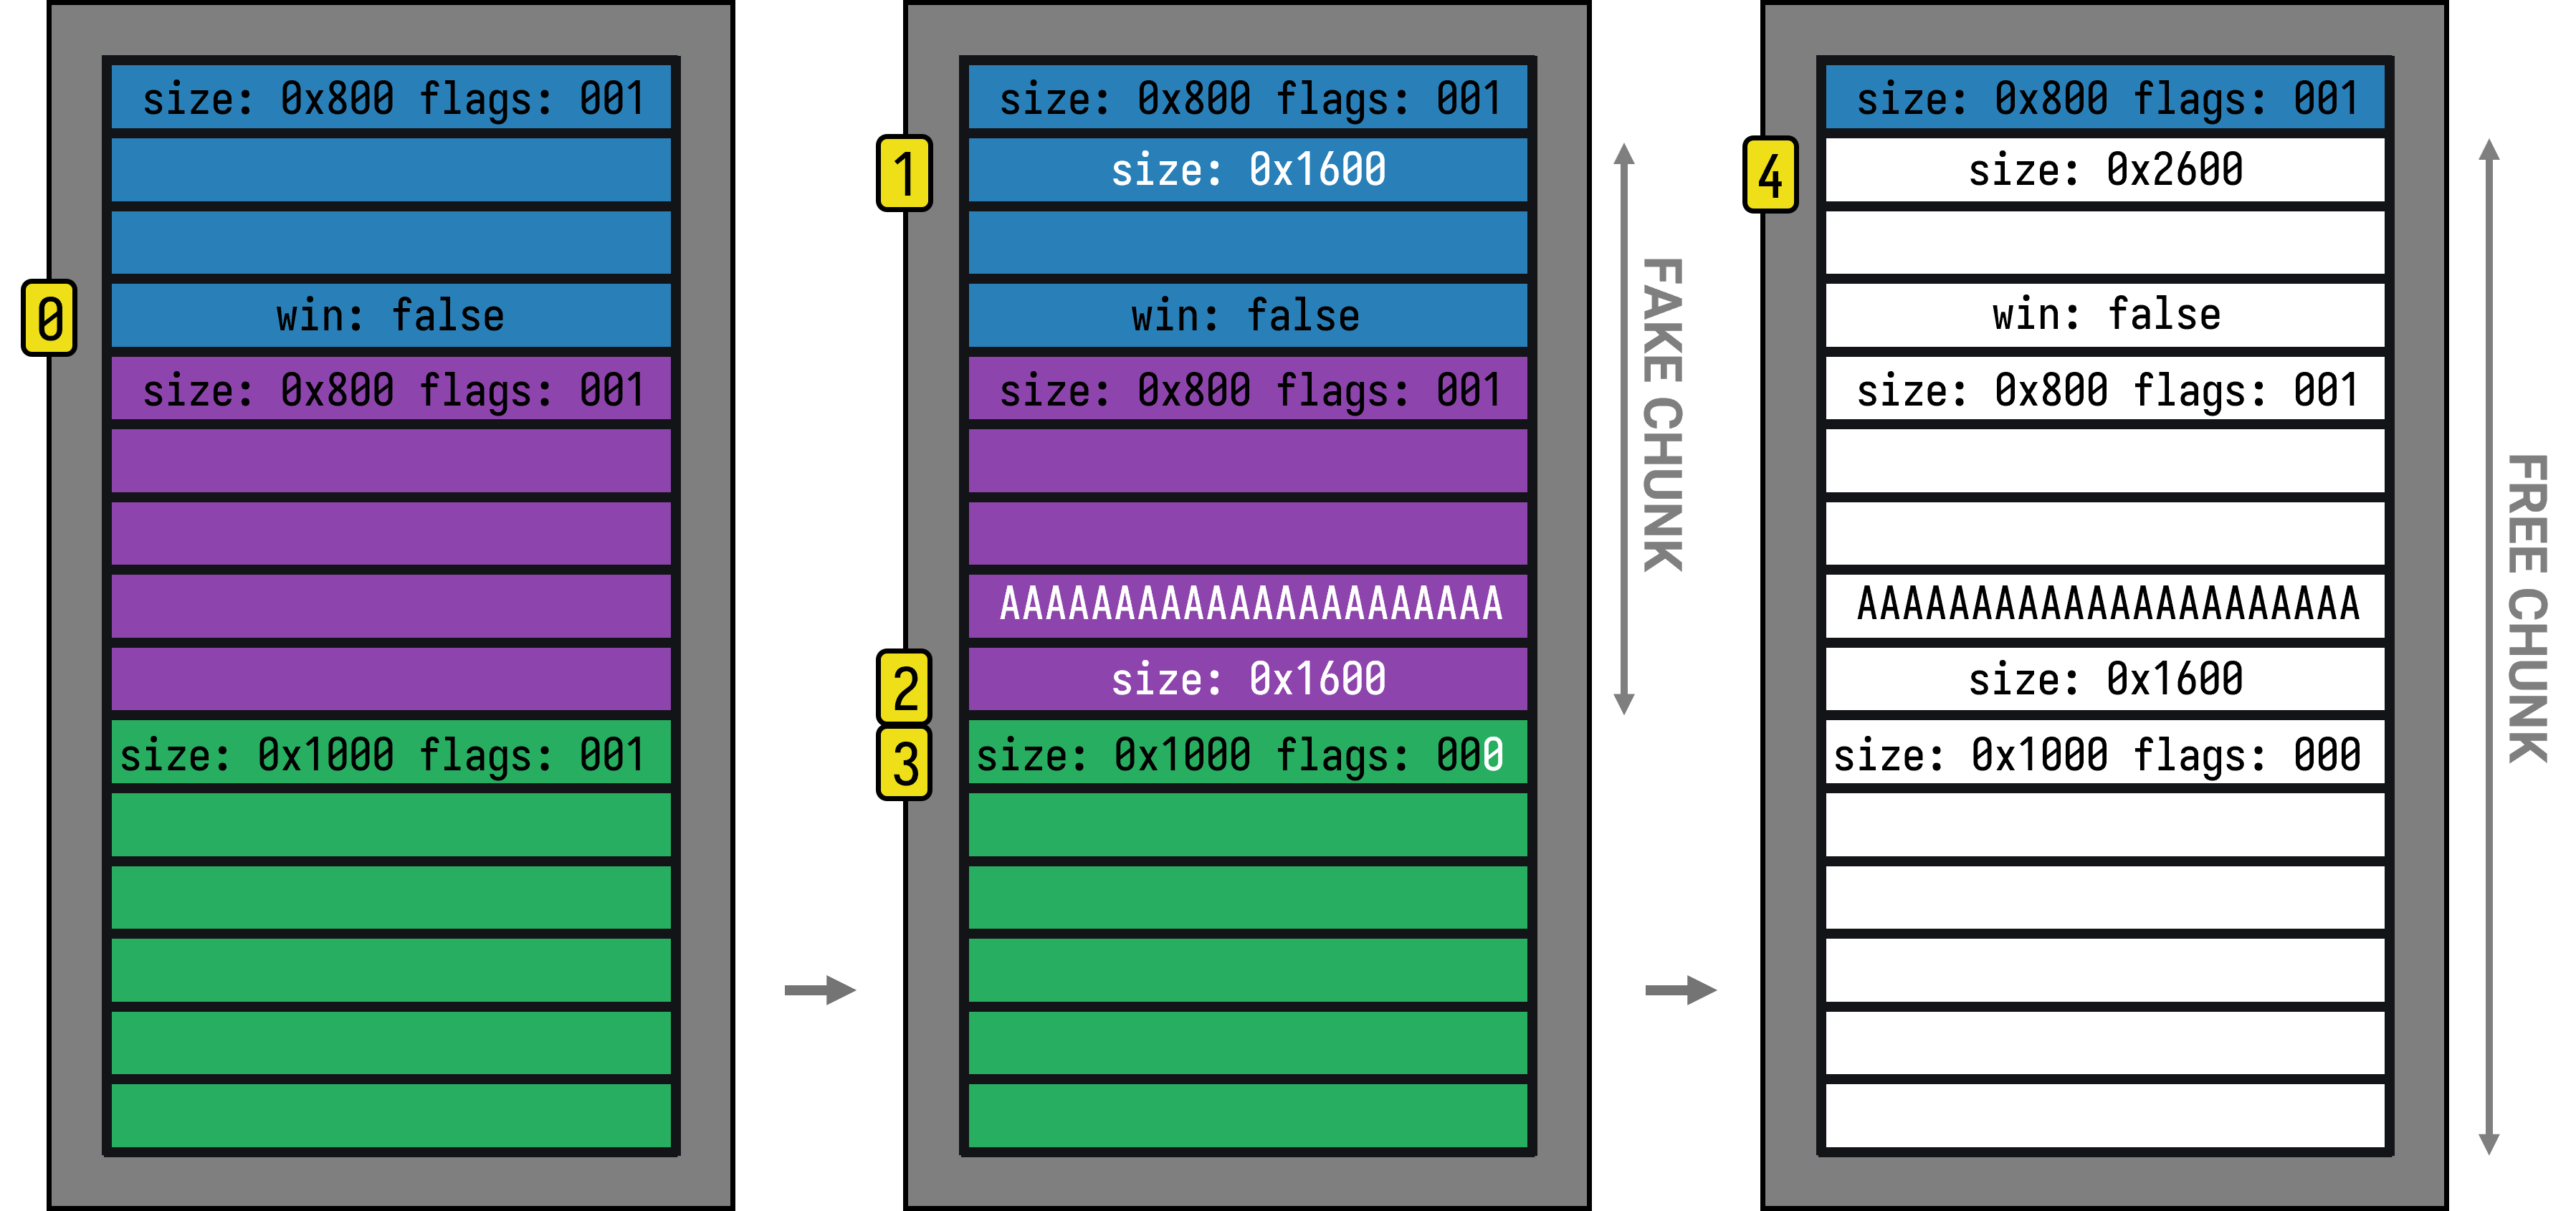
- In this scenario, there is a win variable at position
0that we want to change from false to true, but the program offers no direct way to modify it - We have partial control of the first (blue) chunk and we write a fake chunk size inside it
- We write a matching fake chunk size to the second (purple) chunk. The sizes from steps 1 and 2 must be offset correctly to pass as a valid free chunk
- An off-by-one null byte overflow from step
2corrupts the metadata of the third (green) chunk, clearing itsPREV_INUSEflag and making the allocator believe the that the chunk previous to it is free - When the third (green) chunk is freed, the allocator treats our fake sizes as a valid free chunk and merges them, creating a new free chunk starting at position
4
When we allocate another chunk, it starts at 4 and writes downward, allowing us to overwrite the win variable.
exploitation
Reverse engineering the provided Python solution was more challenging than I expected. At the time, I was still learning heap exploitation and pwntools, and the lack of code comments made it harder to follow. To overcome this, I created visual aids to help follow the stages of the exploit.
The original python solution used the off-by-one bug with the House of Einherjar technique twice to gain a shell. Once I fully understood the exploit, I reimplemented it using brkit and went a step further by simplifying the approach using the library array overflow.
To get an initial information leak, we set the name of the book to /proc/self/maps and triggered read_book(), which leaks the executable’s base address.
The next goal is to leak the base addresses of the heap and glibc. To do this, we increase the settings.comprehension value so that read_book() reads additional data from /proc/self/maps. This value can be overwritten using either the overflow vulnerability in the library array or the off-by-one combined with House of Einherjar technique.
Using this information, we set up an off-by-one overwrite on a chunk that was previously freed and stored in the tcache bins. Following this overwrite, the House of Einherjar technique can be used to corrupt the chunk’s forward pointer to point to glibc’s _IO_2_1_stdout_ global variable. When we request a new allocation matching the corrupted tcache chunk size, it returns a pointer to _IO_2_1_stdout_. We prepare a fake glibc FILE structure to perform a file stream-oriented attack. This structure is crafted in such a way that triggering a write to standard output executes a shell.
The full exploit code can be found in the brkit repository.
heap visualization methods
Understanding heap exploitation is much easier with visualizations than with text alone. Without shapes and colors to organize heap data, I found myself struggling to understand the exploit and to clearly explain it to my partner, Stephen. This challenge motivated me to explore ways to visualize the heap at each stage of the exploit. The main tools I used in this process were pwndbg, PowerPoint, diff, vheap, and Excel.
pwndbg
Pwndbg provides a command called vis that helps visualize the heap by showing chunk data along with their addresses, making it easier to inspect memory layout and changes.
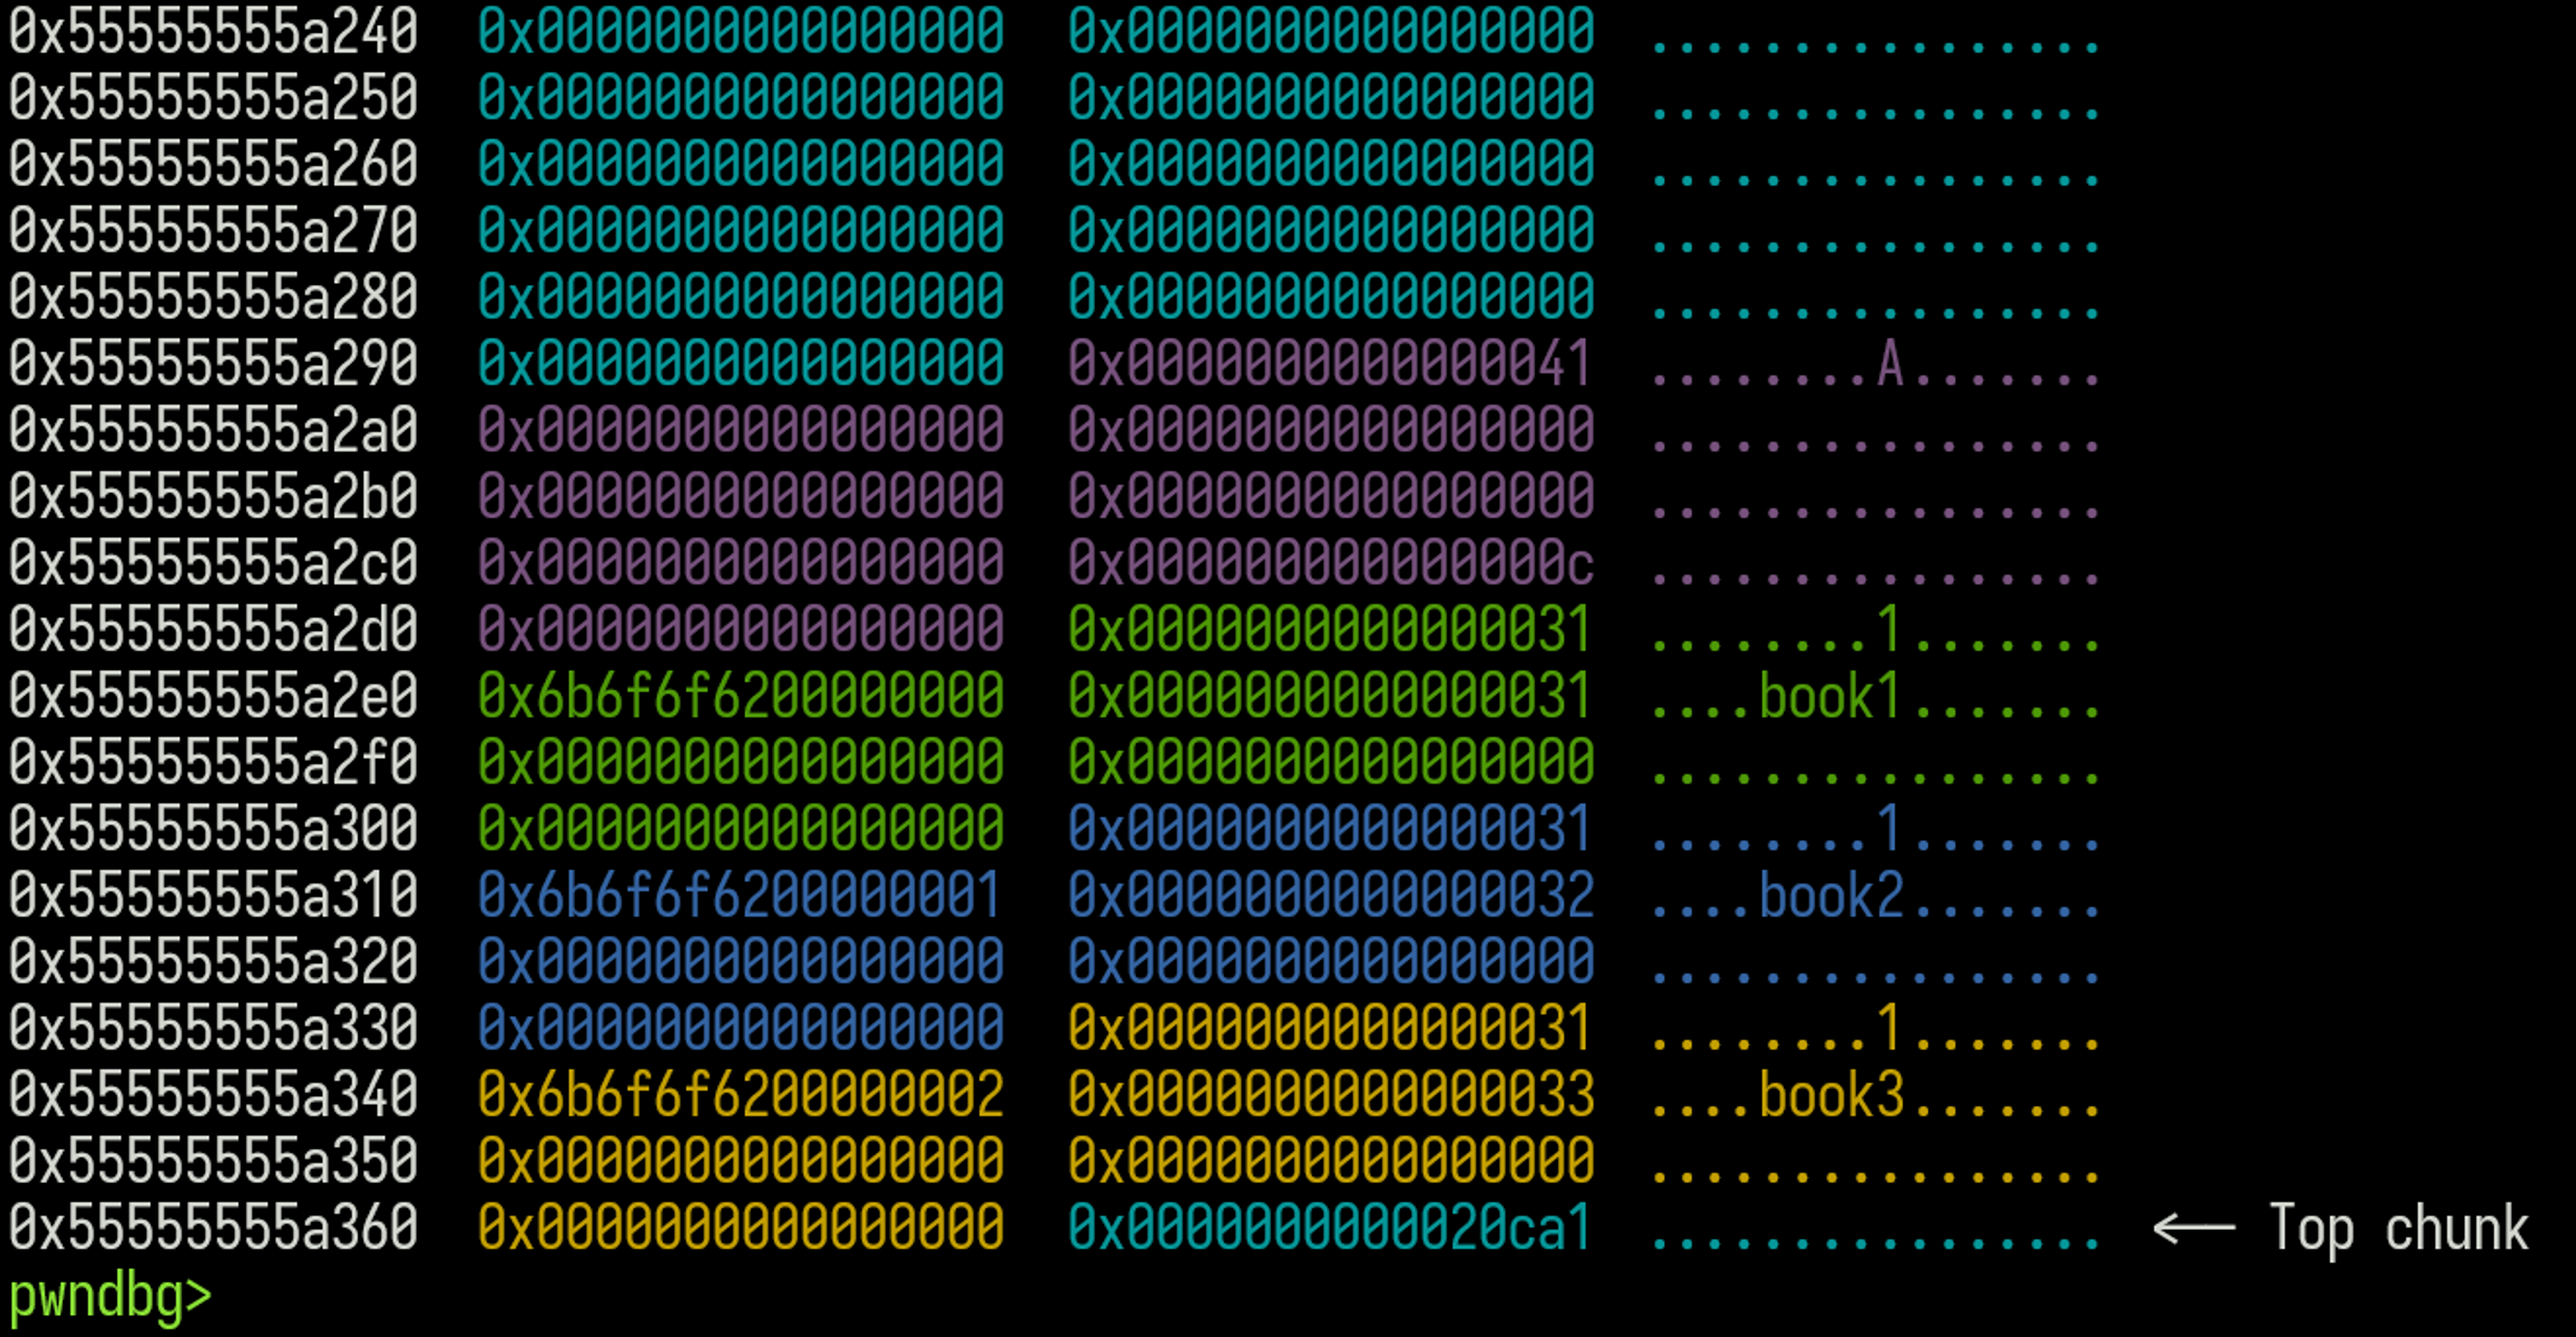
It distinguishes heap chunks with different colors and displays a human-readable view similar to hexdump, but with data grouped in eight-byte chunks. I ran into issues where vis became unreliable, especially when chunks grew large or during the off-by-one overwrite. It would often fail to show the entire heap accurately.
Pwndbg also includes commands like heap, which displays information about all chunks, and tcachebins, fastbins, and unsortedbins, which help inspect the free chunk bins. These commands were helpful, but I still felt like I was missing the full picture of what was happening on the heap as the exploit progressed.
diff
I initially tried using the diff program, but its --color option didn’t give the results I was looking for. I installed colordiff which was closer to what I envisioned, but it highlighted entire lines instead of just the specific characters that changed.
I tried vim -d, but found its highlighting to be inconsistent. The screenshot below shows a vim -d diff of the heap data from pwndbg before and after an off-by-one payload is written. A 0x30-sized chunk is filled with “A” bytes (0x41), and a fake size (0x290) is written at the end. This overflows into the next chunk’s metadata, clearing its flags (the trailing 0x501 becomes 0x500). vim highlights the modified rows in pink and red, making changes easy to spot:
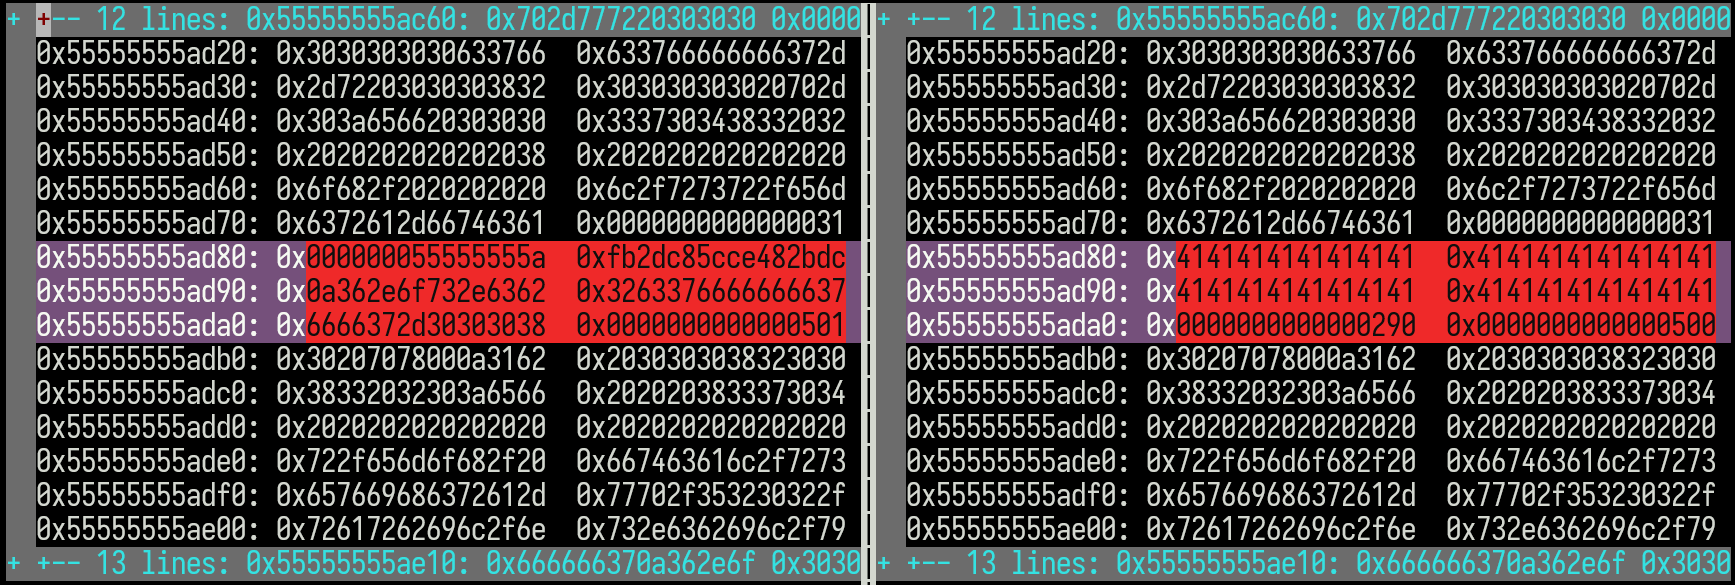
Although I liked this method, preparing a diff for each stage was time-consuming, and the lack of control over chunk formatting made the output harder to interpret.
vheap
My partner found a pwndbg plugin called vheap that visualizes heap state using a web browser. I liked how it laid out the chunks, grouped them by size, and clearly displayed each chunk’s metadata. It’s definitely a tool I will revisit in the future for visualizing my debugging sessions:
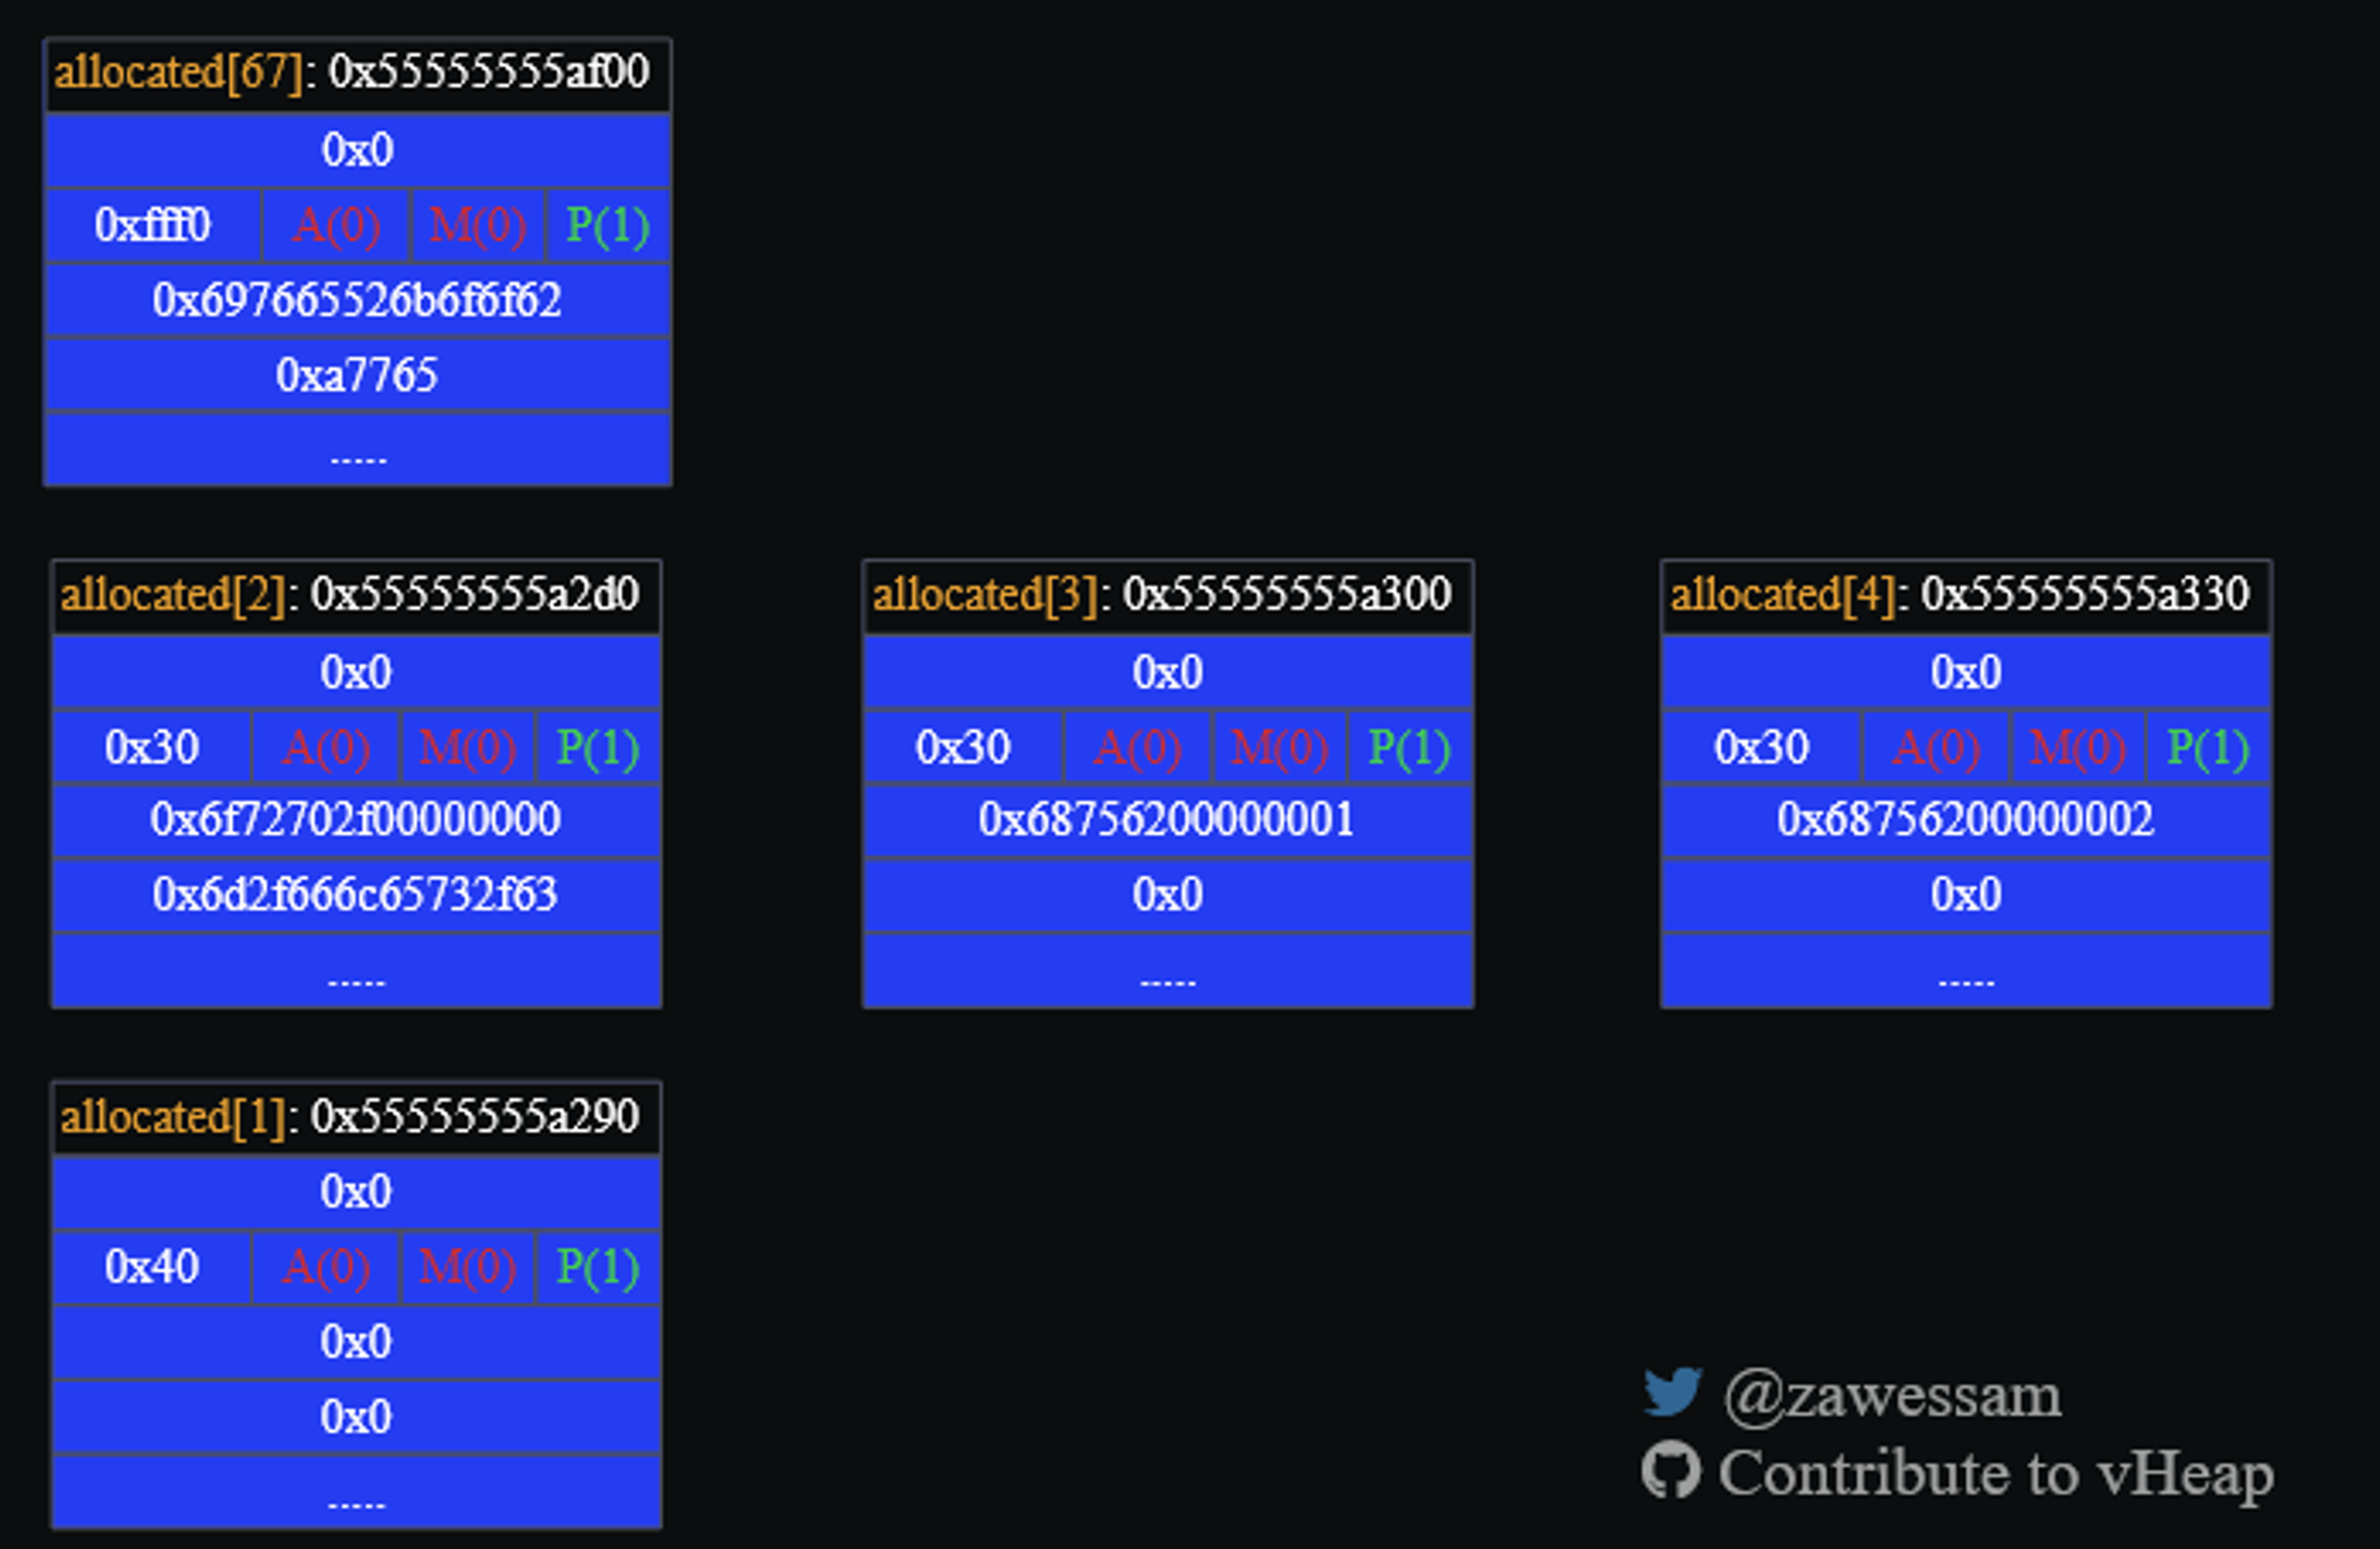
That said, vheap lacked the detail I needed, like chunk data and addresses, and often broke down when the heap was corrupted.
powerpoint
I like using PowerPoint for making quick diagrams and animations. I find it useful and a familiar environment for me to easily create, align, and format vector-based graphics.
Using PowerPoint, I created this animated visual to help illustrate the House of Einherjar exploit:
excel
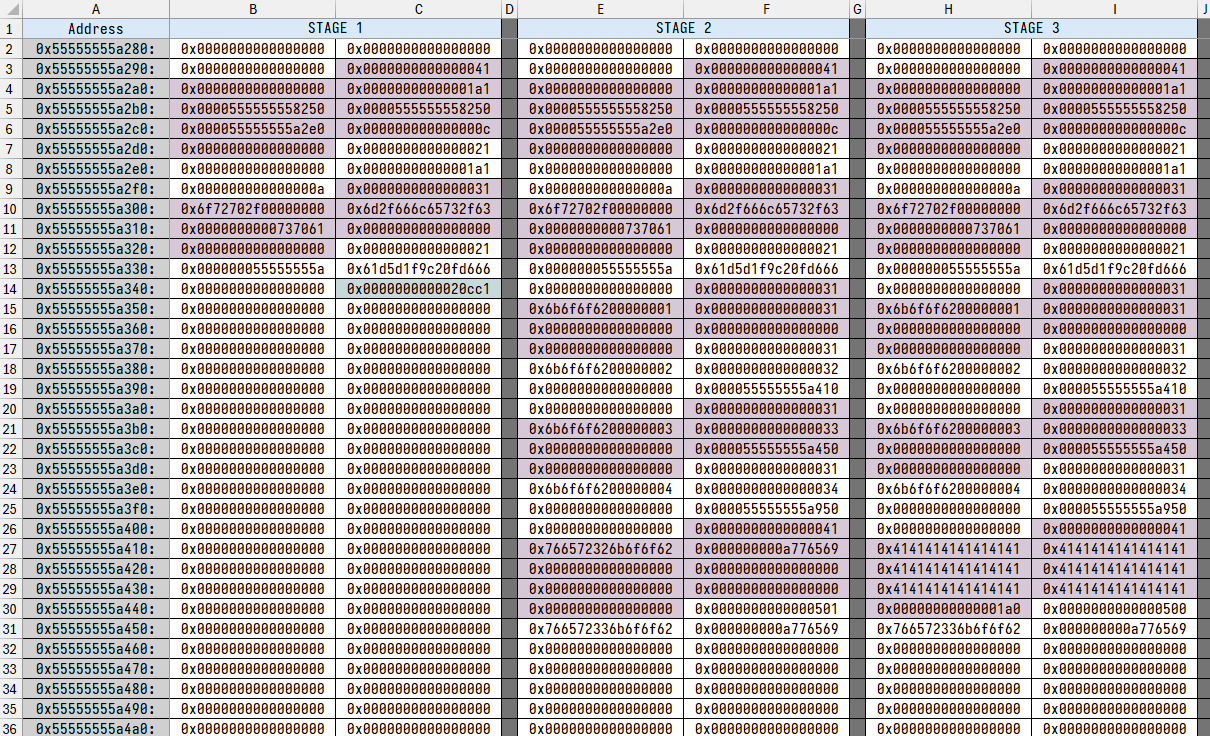
After splitting the exploit into stages, I pasted heap snapshots from pwndbg into Excel. The grid layout made it easy to view each stage side by side and clearly color-code the chunks for better visibility:
brkit improvements
As I worked my way through the python solution, I structured my brkit-based exploit around several fmt.Scanln() calls. The Scanln calls paused execution until I pressed the “enter” key, allowing me to implement pseudo-breakpoints without configuring the debugger.
I then assigned a number to each distinct “stage” of the exploit and saved a heap snapshot after each stage. This strategy saved me from manually finding and setting breakpoints within the vulnerable program and from reconfiguring breakpoints if I restarted pwndbg. Unfortunately it did not scale well as the exploit grew.
We later added staging and pausing functionality into brkit. This new functionality allowed us to name each stage and specify which stage to pause at using an auto-generated command-line flag. It made debugging and stepping through the exploit much easier and more structured.
Defining separate stages in my exploit looks like this:
// STAGE 6 ----------------------------------------------------------------
args.Stages.Next("Free two 0x110 chunks and 0x500 chunk")
I can request execution to stop at a specific stage using a flag:
go run main.go ssh lactf library-shourtcut -s 6Here is a sample of what brkit outputs as the exploit runs:
(...)
[+] executed Stage 5: [Write off by one payload]
[+] starting Stage 6: [Free two 0x110 chunks and 0x500 chunk]
[+] press enter to continue
As a part of adding the stage functionality, we also wrote brkit code that adds boilerplate command-line arguments to the exploit. The automated argument generation code allows users to run their exploit against a process started with Go’s exec library or connect to a process over the network. A brkit user only needs to include the following lines in their exploit to gain several useful command line arguments:
package main

import (
    "gitlab.com/stephen-fox/brkit/process"
    "gitlab.com/stephen-fox/brkit/scripting"
)

func main() {
    proc, args := scripting.ParseExploitArgs(scripting.ParseExploitArgsConfig{
        ProcInfo: process.X86_64Info(),
    })
    defer proc.Close()
}
… and when the brkit user executes their exploit with the -h argument, they get a useful usage document:
$ go run main.go -h
DESCRIPTION
   A brkit-based exploit.

USAGE
  example -h
  example exec EXE-PATH [options]
  example ssh SSH-SERVER-ADDRESS STD-PIPES-DIR-PATH [options]
  example dial ADDRESS [options]

OPTIONS
   -V Log all process input and output
   -h Display this information
   -s int
      Pause execution at the specified stage number
   -v Enable verbose logging
These new changes are available in the latest release of brkit, v0.5.1.
exploit creatively
As someone who enjoys creating art, I usually jump at opportunities to translate abstract ideas into something visual. It gives my eyes something to focus on and helps tie ideas together. This experience has shown me the value of visual diagrams in making complex concepts easier to understand and remember. It’s a reminder that using any tool that aids learning, even if it’s not the traditional choice, is worthwhile. I encourage others to use what works for them, lean into their strengths, and not be too rigid about how problems must be solved. What matters is learning, solving the problem, and helping someone else do the same.